Overview
A design- and data-driven book by ecologist Brian Buma that explores how climate change affects the ecology of North America through eye-catching infographics, dynamic maps, and color photography.
I contributed with 4 full spread and 1 half-page color maps/infographics.
Title: The Atlas of a Changing Climate
Author: Brian Buma
Publisher: Timber Press, 2021
ISBN: 9781604699944
About the Project
Ecologist and National Geographic Explorer Brian Buma contacted me in 2019 to commission some artwork for his upcoming book project. His idea was to write a book that would use images and data visualisation to show how climate really works. He also wanted to explore why climate change and its consequences are affecting our environment and lives in an interconnected way.
The book is divided into five chapters. Brian wanted each section to be introduced by an illustration-heavy infographic, with a consistent style that would carry the theme of the book throughout the chapters.
As for my Cape Horn map, I took inspiration from the the famous illustrated infographics of National Geographic Magazine.
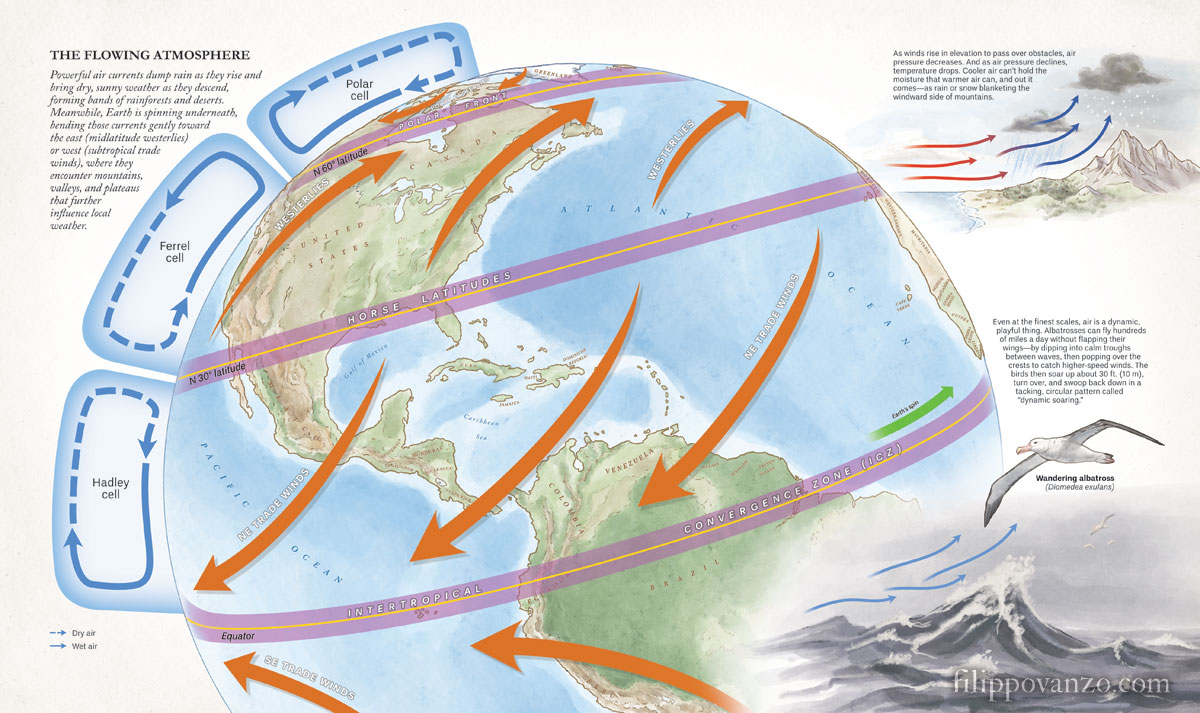
1. Atmosphere
The first chapter focuses on the big picture, the atmosphere, why the winds do what they do. The artwork had to aim at charting the major air currents around the world.
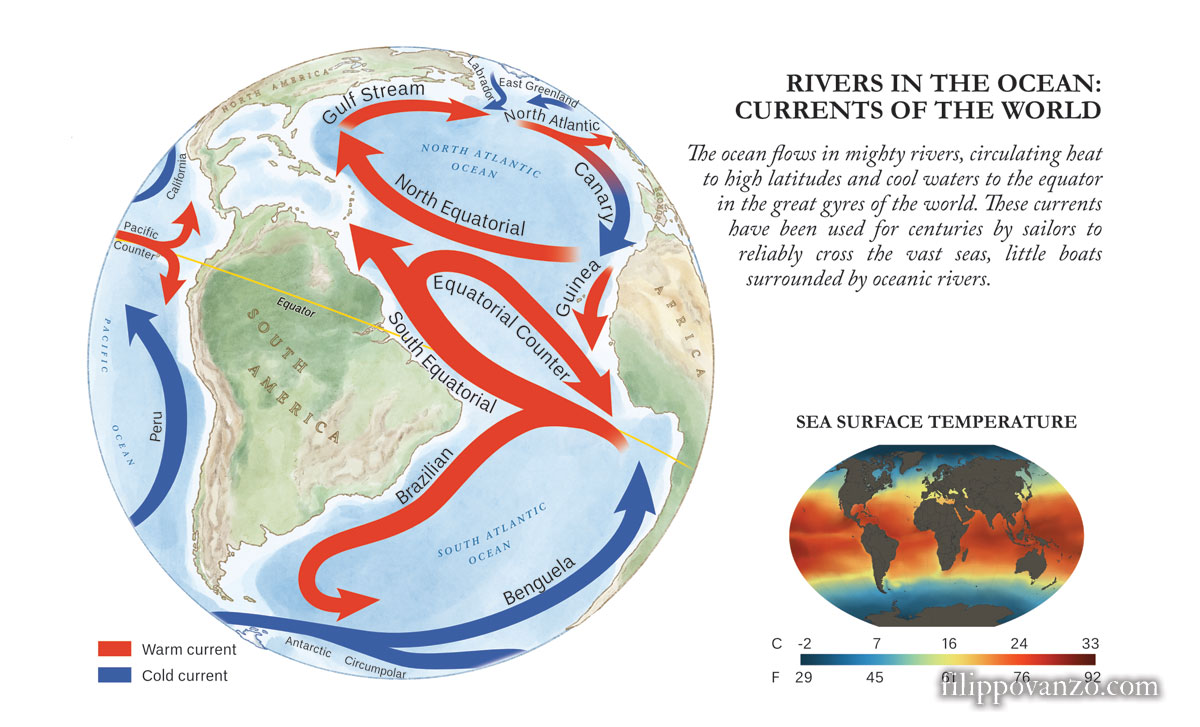
2. Water
Next is oceans, which might be considered the dominant force on the planet. The artwork had to charting the major ocean currents and average ocean surface temperature.
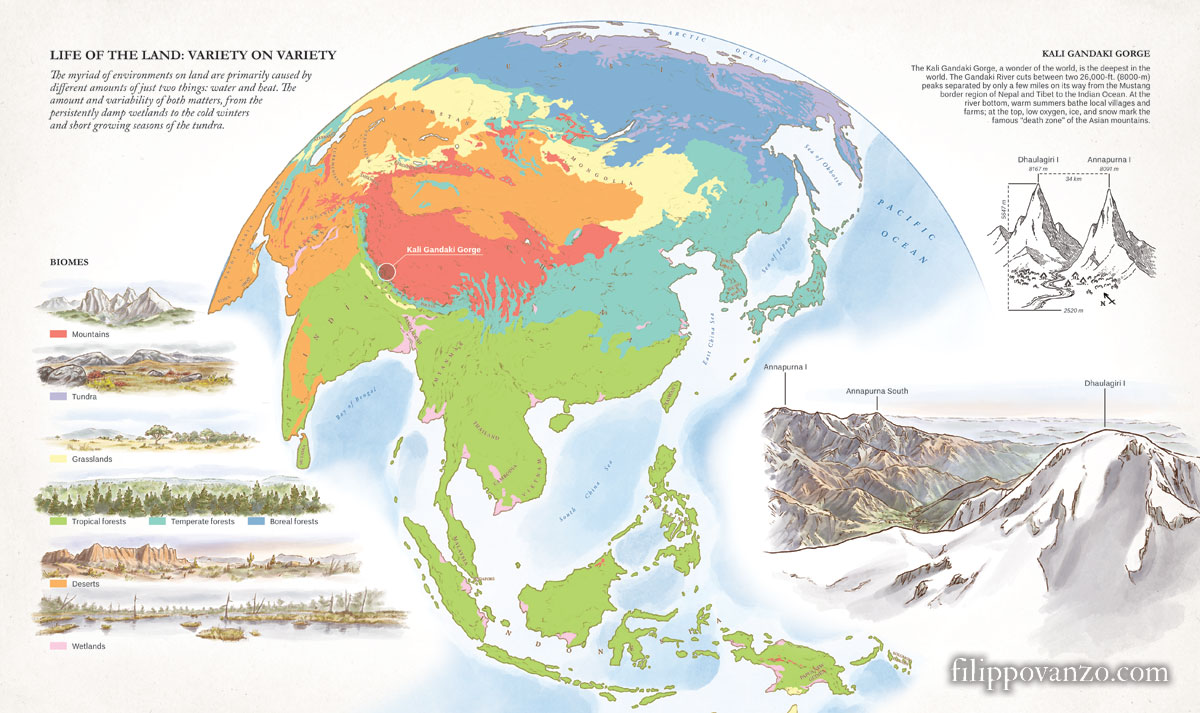
3. Land
Land is where we all (or most of us) live. The purpose of the artwork was to show the variety in landscape habitat and the different biomes around the world. It also had to feature one of the locations mentioned in the opening of the chapter.
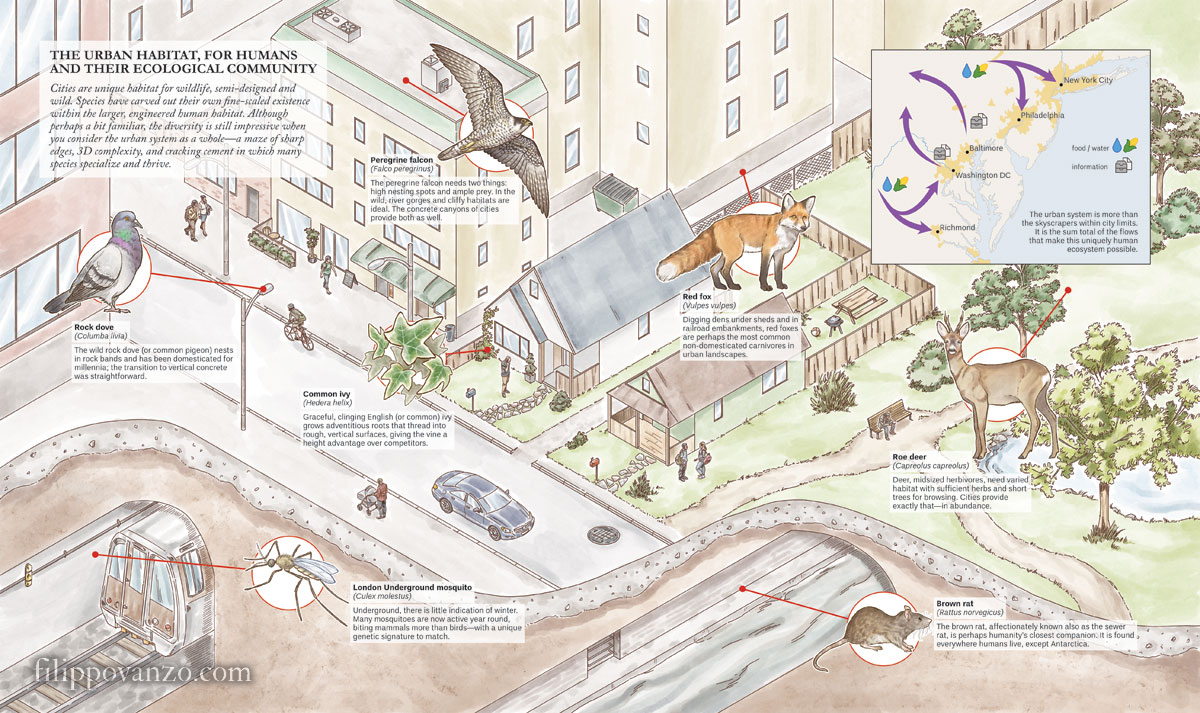
4. Cities
Most people live in urban areas.Cities are a fascinating component of the natural world and they are affected by the same physical forces that operate in climate and the environment. The goal of the artwork was to show the variety of niches that are unique to the urban environment.
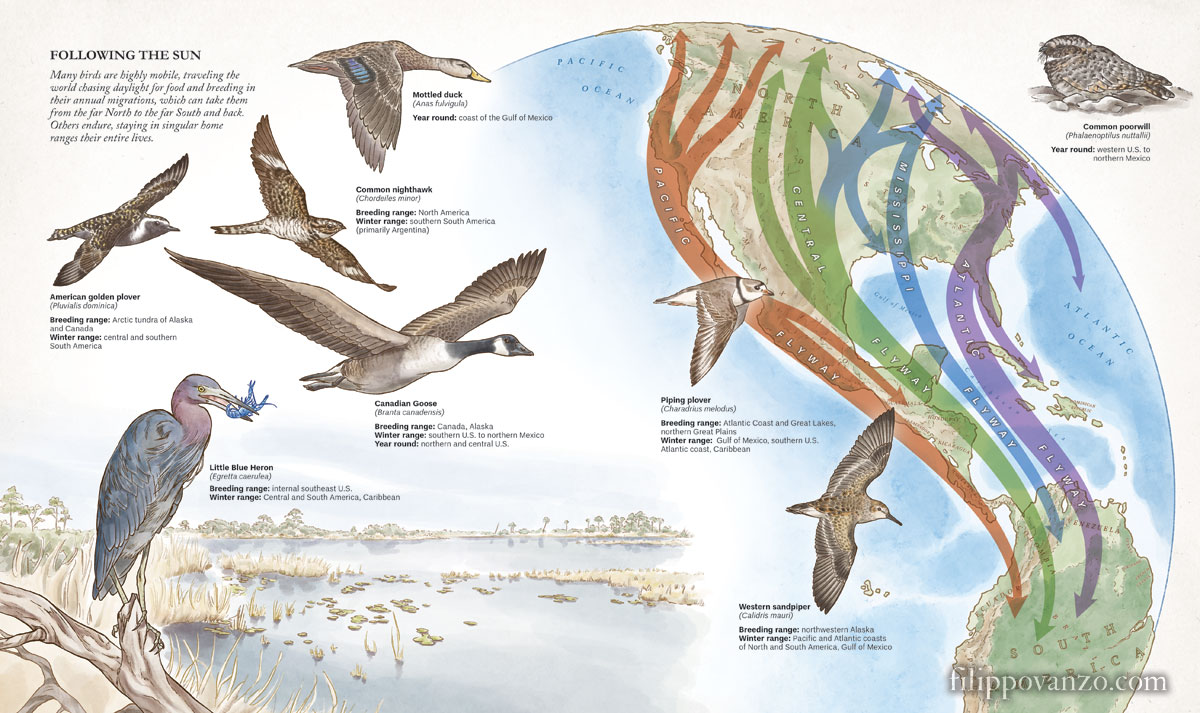
5. Life
Biodiversity is usually where the crisis are hitting when we talk about climate change. The primary emphasis of the artwork was to map and chart birds migration patterns in North and Central America.